A Look at the Georgia Dental Hygiene Workforce Shortage in 2027
Conversations about a shortage dental auxiliaries are evergreen. For the past several years, advocates throughout the United States have encouraged policy changes that could potentially expand the dental auxiliary workforce as well as restructure what they can do. Consequently, other groups have pushed back. The American Dental Hygienists’ Association (ADHA) has engaged in direct, and often inaccurate, messaging around this issue. In Georgia alone, communications have been sent to legislators and posted on social media that seek to persuade without necessarily representing facts about the past or present state of Georgia’s workforce. My aim in this article is to lay out facts from official sources and to demonstrate that they indicate a shortage of hygienists in Georgia.
Is there a Shortage?
The signs of a shortage are present in national data and policy analysis. Only 60.3% of dentists say they have enough hygienists, versus 73.5% reporting an adequate number of assistants, and over 90% of those recruiting say it is either very or extremely challenging.1,2 The Health Resources and Services Administration’s (HRSA) Workforce Projection continues to predict a shortage in Georgia. FY 2025’s model indicates a need for 100 hygienist full-time equivalents (FTE) in 2027.3 HRSA’s model also indicates a growing national shortage, rising from 24,390 FTE in 2027 to 33,220 FTE in 2038.3
Georgia is seeing hygienists’ wages rising faster than inflation, a possible sign of a tight labor market.4,5 Adjusted annual income for the 25th percentile rose from $67,309 in 2020 to $81,140 in 2025. In the 5 years prior to 2020, annual incomes at the 25th percentile ranged from a low of $66,301 to a high of $73,817. Annual median income is at the highest it has been since 2014 at $95,490.
Thinking Through Supply and Demand
As with all labor supply issues, determining whether a given area has a sufficient supply of ~dental auxiliaries requires looking at several factors. Different populations use different amounts of dental care. Depending on factors like age distribution, dental benefits coverage, and household income, a given group of people will seek dental care at different rates. Only 40.6% of working-age adults saw the dentist in the past year, but 53.2% of children had at least 1 appointment.6 Households with incomes above 400% of the federal poverty line (FPL) see the dentist more than twice as much as those below 100% FPL.6 Generally, utilization has risen since 2024.
Whether the overall labor supply is rising with utilization and population growth is an open question.1 HRSA’s model predicts a national decline in supply.3 National trends in admission and graduation rates are on the right track. The number of students admitted to hygiene programs grew between 2022 and 2026, 15.7% or 1,285 students, as did the number graduating, 7.6% or 557 students.1,7 Meanwhile, the Bureau of Labor statistics projects employment growth of 7 percent with an average of 15,300 openings projected each year.8 Unfortunately, even positive national education trends are not reflected in Georgia’s enrollment. Georgia hygiene schools’ reported total capacity has fallen from 342 in 2019 to 321 in 2025, and in that time graduation rates have hovered around an average of 269 graduates each year.9
An Analysis Using Georgia Specific Data
National models use data from several different sources, but they may not consider specific local data. Understanding the underlying assumptions used to make the model helps an individual evaluate its usefulness in decision making. One key factor to consider with HRSA models is that the base-year data lags the current year. HRSA’s FY 2025 model begins in 2023. Some caution in interpreting the model is justified, but it better reflects post-pandemic reality than the preceding 2 years’ versions. A substantial number of dental hygienists took a hiatus from the workforce during the COVID-19 pandemic and several subsequent years (Figure 1). Only after 2022 did the workforce return to full strength, and even then, absolute growth appears to be relatively flat, especially compared to the period between 2015 and 2018.
Figure 1.
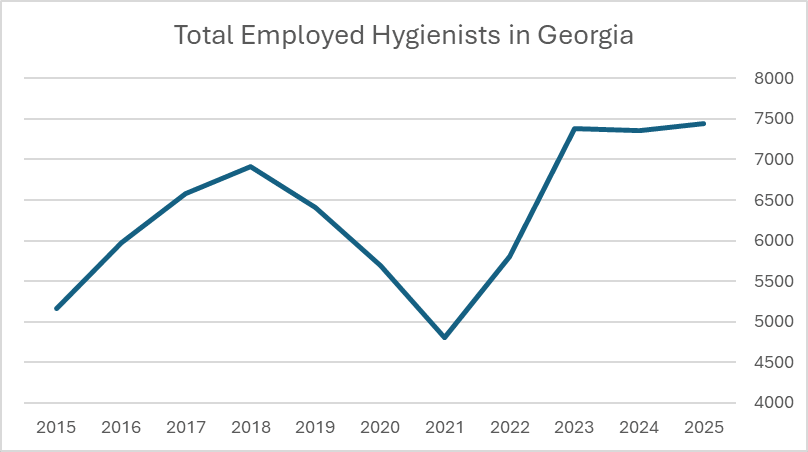
Recent years have been characterized by significant anxiety about post-pandemic workforce attrition.10,11 This narrative continues to be propagated on social media and in public forums; however, it does not reflect current realities. Data provided by the Georgia Board of Dentistry confirms that the count of hygienist licenses lapsed as a proportion of licenses that could be renewed does not appear to be trending upward. In other words, stagnation or decline in supply is most likely a result of restrictions on entry into Georgia’s hygiene workforce.
Even with a rosier picture with respect to attrition, Georgia needs to add more hygienists. I predict that Georgia will need a minimum 72 additional hygienists in 2027 just to meet existing demand, a number similar to HRSA’s projection. To arrive at this estimate, the following steps were taken.
To estimate demand, begin by examining population and utilization (Table 1). Georgia’s projected population in 2027 will be 11.5 million people, and ADA’s Health Policy Institute (HPI) indicates that less than half will have at least 1 dental appointment during the year.6,13 People in the United States who access dental care go to the dentist around 2.3 times per year.14 The bulk of these appointments will be routine hygiene appointments. If just under 46% are utilizing dental care, then almost 5.3 million people will be expected to have the opportunity to receive hygiene care. Use of HPI’s estimate is a conservative choice. Other recent estimates place utilization slightly above 46%.14 Assuming a standard 2 cleanings annually for all patients, and an additional annual cleaning for some based on the burden of severe periodontitis in Georgia, results in an estimate of just over 11 million hygiene appointments required to meet existing demand.
|
Table 1. Estimating Hygiene Annual Appointments Needed in Georgia |
||
|
A. Population |
11,544,713 |
Governor's OPB |
|
B. Utilization Rate |
45.8% |
ADA HPI |
|
C. Utilizing Population |
5,287,479 |
A * C |
|
D. GA Periodontitis Burden |
8.3% |
Wang et al. 2026 |
|
E. Appointments Needed |
11,012,919 |
C*2 + C*0.083 |
For the sake of simplicity, this analysis assumes that the burden of periodontitis is shared equally by the utilizing population and the non-utilizing population. This assumption may shift a disproportionate share of the burden of periodontitis to the utilizing population. After all, periodontitis prevalence varies based on certain demographic factors: Middle aged and older adults, as well as men, have higher prevalence than younger age cohorts and women.15 Geographic variation may also be attributable to economic trends, public investment in dental care, and habitual patterns of utilization that correlate with demographic characteristics.15
Despite the possibility that some of the periodontitis burden may be overrepresented in the estimate, one should recognize that the prevalence of this disease represents potential pent-up demand for a particularly time intensive set of dental hygiene services, and as such, highlights a need unexamined by this analysis.15,16 Georgia’s overall periodontitis burden is a reminder that the need estimated in this analysis falls well short of Georgia’s total dental need, and policy changes that substantially boost access to care, by increasing dental benefits coverage or increasing household discretionary income, will consequently deepen any existing shortage.
Will Georgia’s hygienists in the workforce in 2027 be able to cover this demand? Probably not (Table 2). This analysis takes an optimistic view of the growth of Georgia’s hygiene workforce by assuming education and immigration trends in Georgia will remain consistent with the recent past. Georgia had 7,440 working hygienists last year.5 Based on licensing data from 2013-2026, trends show that the Georgia Board of Dentistry has issued a net positive 108.75 licenses annually after accounting for attrition. Adding an additional 216.5 working hygienists to the workforce indicates that Georgia should have around 7,657.5 hygienists in 2027.
|
Table 2. Estimating Hygienist Shortfall in 2027 |
||
|
F. Estimated 2027 GA Hygienists |
7657.5 |
BLS and GBD |
|
G. Average Annual Clinical Time |
1,425 |
SC AHEC |
|
H. 1 Hour Appointments |
10,910,406 |
F * G |
|
I. Unavailable Appointments |
102,513 |
E (Table 1) - H |
|
J. Hygienists Needed |
72 |
I / G |
A key assumption of this analysis is that the average time hygienists work will neither rise nor fall thanks to new additions. The result of this analysis is sensitive to this assumption. To calculate the annual working hours of a dental hygienist, this analysis uses a reported average from the South Carolina’s Office for Healthcare Workforce.17 Among data briefs reviewed, South Carolina’s is unique in that it distinguishes between clinical time and administrative time. In general, briefs reviewed for this analysis agree that the average hygienist is working somewhere around 30 hours a week.17–19 Averages were also relatively consistent over time. South Carolina’s brief reported an average of 27.4 hours spent on patient care per hygienist.17 Assuming there is an opportunity for hygienists to work 52 weeks in a calendar year, each hygienist contributes 1,425 hours of clinical time annually.
Dental hygiene publications routinely advocate for a standard 1-hour appointment.20–23 This analysis will adopt this standard across the board for the sake of simplicity. Treatment for advanced periodontal disease typically exceeds 1-hour.16,24 Treating the subset of appointments requiring this care according to a 1-hour standard will shift the estimate of total required time in a conservative direction. Multiplying average annual clinical time by the predicted number of hygienists yields just under 11 million appointments and a gap between supply and demand of around 100,000 appointments. Dividing this by the total number of annual clinical hours yields a need for 72 additional hygienists in 2027.
Potential for Variation
Uncertainty is baked into the above analysis. To quote Yogi Berra, “It’s tough to make predictions, especially about the future.” Small adjustments to weekly time worked, the number of appointments required per patient, or the length of each appointment, may shift this analysis toward a surplus of available appointment time rather than a deficit. Recognizing this uncertainty, steps were taken throughout to pad the estimate in favor of greater time available per hygienist and to reduce the time needed per patient. Sources and methods selected for use in developing the estimate were ones that would present the most optimistic case. An effort was also made to avoid drifting too far from reality.
Perhaps the most significant statistic in this discussion is utilization. Sources indicate that less than half of all Americans routinely access dental care. Some may avoid the dentist by choice, but many do not have that choice due income and other factors. The result is an untapped reservoir of demand for preventative care.
I also elected to evaluate available care at the level of the state without regard for well understood geographic variation in Georgia. Given that Georgia barely educates enough hygienists to replace retirees, it must rely on immigration into the state to keep up with population growth. Interstate migration may shrink over time as other states compete for hygienists, and those relocating to Georgia appear to be selecting specific places to go. Urban centers in Georgia are saturated. Fayette County had 135 hygienists per 100,000 residents in 2025.19 The state average in 2025 was 66 per 100,000. Most counties fall below the average.19 The result is that some areas of Georgia feel a shortage more acutely than others, and sufficient mismatches between supply and demand may result in inefficiencies in the delivery of care not readily identifiable above.
Responding to the Shortage in the Short Term
In 1992, ADHA published a report on retention of the hygiene workforce.25 Part of the reason the study remains interesting is due to the cultural cache of its arguments. Statistically significant factors distinguishing hygienists who leave permanently versus temporarily included input into decision making, both related to care and office policies, and boredom.25 Hygienists who were temporarily unemployed cited salary and benefits as major motivating factors for transitioning settings.25 These preferences are still used in talking points today.
Fast forward several decades, and the picture of why hygienists leave a particular job has not changed all that much. Hygienists cited workplace culture, salary, and feeling overworked as reasons for dissatisfaction, and those departing voluntarily from practices mentioned similar reasons.10 Meanwhile, expenses have been rising, and reimbursement is lagging inflation.1,2 HPI has dubbed this a “fiscal squeeze” on dental practices.
It’s important to note that both in 1992 and in 2022 most hygienists were satisfied with their role.10,25 Factors related to this satisfaction included work-life balance, positive culture, and an ability to help patients.10 Practices interested in attracting and retaining staff can always look at reimbursement and benefits structures, but soft skills matter too. A focus on a healthy and collaborative work environment where individual contributions to the team are recognized can go a long way.
In the long-term, more hands will be needed to stabilize the workforce. Different strategies are being tried. Some argue that the Commission on Dental Accreditation is the main bottleneck, and that tight clinical education ratios restrict new entrants.26 Others are seeking new licensees with training from foreign jurisdictions or allowing dental assistants to scale above the gumline to free up hygienists for other tasks. Georgia is investing in new spaces to educate hygienists.27,28 GDA will continue to advocate for reforms that grow Georgia’s dental auxiliary workforce to an adequate level.
References:
1. We Have a Major Dental Hygienist Shortage. It’s Unlikely to Go Away Soon. American Dental Association Health Policy Institute. April 2026. Accessed June 14, 2026. https://www.ada.org/resources/research/health-policy-institute/dentist-workforce/dental-hygienist-shortage
2. The State of the U.S. Dental Economy 1st Quarter 2026 Update Plus a Closer Look Into Staffing Challenges. 2026. Accessed June 11, 2026. https://www.ada.org/-/media/project/ada-organization/ada/ada-org/files/resources/research/hpi/state_us_dental_economy_q12026.pdf?rev=6adbd369eaa74237b742fec0b9aeeae1&hash=170FD0002E7F24954324B39E0C4D1A8D
3. Workforce Projections. Health Resources & Services Administration. December 18, 2025. Accessed December 5, 2026. https://data.hrsa.gov/topics/health-workforce/workforce-projections
4. Consumer Price Index Historical CPI-U, May 2026. U.S. Bureau of Labor Statistics. May 2026. Accessed June 11, 2026. https://www.bls.gov/cpi/tables/supplemental-files/historical-cpi-u-202605.xlsx
5. Occupational Employment and Wage Statistics Query System. U.S. Bureau of Labor Statistics. 2026. Accessed December 5, 2026. https://data.bls.gov/oes/#/home
6. National Trends in Dental Care Use, Dental Insurance Coverage, and Cost Barriers. 2026. Accessed June 14, 2026. https://www.ada.org/-/media/project/ada-organization/ada/ada-org/files/resources/research/hpi/national_trends_dental_use_benefits_barriers_2026.pdf?rev=7ba37265adbc4691ac1580144544c6e5&hash=E253C60EBDA44B2E551FF2CC3A479BB5
7. Commission on Dental Accreditation Dental Education Program Enrollment and Graduates Trends Report, 2025-26. 2026. Accessed June 24, 2026. https://www.ada.org/resources/research/health-policy-institute/dental-education
8. Dental Hygienists. U.S. Bureau of Labor Statistics Occupational Outlook Handbook. August 28, 2025. Accessed June 11, 2026. https://www.bls.gov/ooh/healthcare/dental-hygienists.htm
9. Commission on Dental Accreditation Survey of Allied Dental Education: Report 1- Dental Hygiene Education Programs. American Dental Association Health Policy Institute. Accessed June 24, 2025. https://www.ada.org/resources/research/health-policy-institute/dental-education
10. ADA Health Policy Institute in Collaboration with American Dental Assistants Association, American Dental’ Association, Dental Assisting National Board, and IgniteDA. Dental Workforce Shortages: Data Navigate Today’s Labor Market. 2022. Accessed September 9, 2024. https://www.ada.org/-/media/project/ada-organization/ada/ada-org/files/resources/research/hpi/dental_workforce_shortages_labor_market.pdf?rev=e6025d77df184e6c95dc7cefde4adee3&hash=225FCBBCCB67174AAFC760FE2287322D
11. Hendrick L. How Dental Hygiene Went from Thriving to Threatened. Dimensions of Dental Hygiene. June 30, 2025. Accessed June 24, 2026. https://dimensionsofdentalhygiene.com/how-dental-hygiene-went-from-thriving-to-threatened/
12. The State of the U.S. Dental Economy 4th Quarter 2025 Update Plus: A Look Ahead into 2026. 2026. Accessed March 26, 2026. https://www.ada.org/-/media/project/ada-organization/ada/ada-org/files/resources/research/hpi/state_us_dental_economy_q42025.pdf?rev=c2f096aab4074ddc92395e6b04613963&hash=22401EF8FEB98992BF063DFC86C2A8BB
13. State Residential Population, 2025-2060. Governor’s Office of Planning and Budget Population Projections. 2026. Accessed June 11, 2026. https://opb.georgia.gov/census-data/population-projections
14. Olaisen R, Manski RJ. Dental Utilization and Expenditures, U.S. Civilian Noninstitutionalized Population Aged 2 and Older, 2019-2021. Statistical Brief #555. 2024. Accessed June 24, 2026. https://meps.ahrq.gov/data_files/publications/st555/stat555.shtml
15. Wang Y, Zhao X, Yu Y. The burden of severe periodontitis in the United States: Insights from a population-based analysis. Journal of the American Dental Association. Published online February 1, 2025. doi:10.1016/j.adaj.2025.09.015
16. Jamison CL, Bray KK, Rapley JW, Macneill SR, Williams KB. Analysis of patient factors impacting duration of periodontal maintenance appointments: an exploratory study. J Dent Hyg. 2014;88(2):87-99.
17. Characteristics of the South Carolina Dental Hygienist Workforce in 2015 . 2018. Accessed March 26, 2026. https://www.scahec.net/scohw/data/reports/122-2015-Dental-Hygienists.pdf
18. Alary M. Dental Hygiene Labour Survey Canada 2002. 2002. Accessed June 24, 2026. https://www.cdha.ca/pdfs/Profession/Policy/cdha_survey_2002.pdf
19. Greenwood L, Moore L, Harris B, Dever A. Dentist Workforce Report 2025. 2025.
20. Forbes K. The 60-minute hygiene appointment. RDH Magazine. Published online October 28, 2015. Accessed June 10, 2026. https://www.rdhmag.com/career-profession/article/16405302/the-60-minute-hygiene-appointment
21. Berry K. Five time management secrets for the dental hygiene appointment. Friends of Hu-Friedy. Accessed June 10, 2026. https://www.friendsofhu-friedy.com/s/news/a2H36000001xpxZEAQ/five-time-management-secrets-for-the-dental-hygiene-appointment
22. Gordon S. DENTISTS: Why You Should Give Your Hygienist 60 Minute Appointments. RDH Magazine. Published online November 26, 2023. Accessed June 10, 2026. https://www.todaysrdh.com/dentists-why-you-should-give-your-hygienist-60-minute-appointments/
23. Davis K. Why 60 Minutes Works Here’s the case for one-hour block scheduling. RDH Magazine. Published online May 25, 2016. Accessed June 10, 2026. https://www.rdhmag.com/career-profession/article/16409402/why-60-minutes-works-heres-the-case-for-one-hour-block-scheduling-for-dental-appointments
24. Barnett R, Buckland E, King T, Pabary S. Wimpole Timings study. Br Dent J. Published online 2024. doi:10.1038/s41415-024-7521-6
25. Meador R. Extension Study: Retention of Dental Hygienists in the Workforce Final Report. 1992.
26. Killpack B. It’s Time for CODA to Change. Washington State Dental Association. May 30, 2024. Accessed June 25, 2026. https://www.wsda.org/news/blog/2024/05/30/bracken-killpack--it’s-time-for-coda-to-change
27. Litteer H. AU breaks ground on new Dental College of Georgia campus in Savannah. JAGWire. May 11, 2026.
28. Clayton State University announces a $14.5 million renovation to modernize the home of the College of Health. Clayton State University. March 16, 2026. Accessed June 25, 2026. https://www.clayton.edu/news/renovation-of-the-college-of-health.php